
Here’s a scenario that plays out in loan offices every week: a woman business owner walks in with three years of profit, a growing customer base, and a clear plan for the capital she’s asking for. The lender asks her to walk through her financials. She says, “My accountant handles all that.”
The loan gets denied.
Not because her numbers were bad. Because she couldn’t narrate them.
Lenders aren’t just evaluating your business — they’re evaluating you as the operator of that business. If you can’t explain your own P&L, you signal one of two things: either you’re not in control of your finances, or your finances aren’t what they appear. Either way, you lose.
This is fixable. You don’t need an MBA. You need 90 minutes with this guide and your last three years of financial statements. By the end, you’ll be able to sit across from any lender and tell the story of your business in numbers — fluently, confidently, and on your own terms.
Why This Matters More Than You Think
The Federal Reserve’s Small Business Credit Survey consistently finds that women-owned businesses face higher denial rates and receive smaller loan amounts than comparable male-owned businesses. Some of that gap is structural bias — documented, real, and worth fighting. But some of it is the confidence gap in financial fluency, and that’s something you can close today.
Research shows that women business owners are significantly more likely than men to defer financial conversations to their accountant or bookkeeper. That deference, however well-intentioned, becomes a liability at the loan table. A lender isn’t looking for someone who has good numbers. They’re looking for someone who owns their numbers — who can walk through them, explain the anomalies, and connect them to a forward-looking story.
The good news: financial statements are not complicated. They follow a consistent logic. Once you understand what each statement is measuring and why lenders care about specific lines, you’ll see that your business has been telling this story all along. You just haven’t been reading it the way banks do.
Set aside 90 minutes. Pull your P&L, balance sheet, and cash flow statement for the last three fiscal years. Work through this guide with those documents in front of you. By the time you’re done, you’ll be ready.
The Profit & Loss Statement — Your Business in One Page
What it is: The P&L (also called the income statement) shows your revenue minus your expenses over a period of time — usually a month, quarter, or year. The bottom line is net income: what your business actually kept after paying for everything it takes to run.
The formula is simple:
Revenue − Cost of Goods Sold = Gross Profit
Gross Profit − Operating Expenses = Net Income

What lenders look at first:
- Revenue trend. Is your business growing, flat, or declining over the last three years? A lender wants to see a trajectory. Flat revenue isn’t automatically disqualifying — but you need to explain it. Declining revenue without a clear explanation is a red flag.
- Gross margin. Your gross profit divided by revenue. This tells the lender how efficiently you produce your product or service. Industry benchmarks vary — a software company might run 70%+ margins while a restaurant might run 30–40%. Know where your industry sits and know where you sit within it.
- Owner compensation. Lenders will look at what you pay yourself, whether as salary or distributions. This matters because it affects how they calculate your actual cash flow.
The numbers that trip women up:
- Owner salary vs. distributions. If you’re an S-corp or partnership, you may take money through distributions rather than a W-2 salary. Lenders know this — but they want you to be able to explain the difference and show the full picture.
- Add-backs. One-time or non-recurring expenses (a piece of equipment you purchased, a legal settlement, a one-time marketing push) can suppress your net profit in a given year. These can often be “added back” when calculating your true earning power — but you have to know they’re there and be able to argue for them.
- One-time revenue spikes. A year you landed an unusually large contract can inflate revenue in a way that isn’t sustainable. Lenders will ask. Have an honest answer ready.
Your homework:
Pull your P&L for the last three years. For each year, note:
- Total revenue
- Gross profit margin (gross profit ÷ revenue)
- Net income
- Your compensation (salary + distributions)
Now ask: can you explain every line on this statement to someone who’s never set foot inside your business? If there’s a line you’re fuzzy on, that’s where to focus before your lender meeting.
The Balance Sheet — What You Own vs. What You Owe
What it is: The balance sheet is a snapshot of your business at a single point in time — typically the last day of your fiscal year. It answers one question: if you stopped operating today, what would be left?
The formula:
Assets − Liabilities = Owner’s Equity
Assets are what your business owns (cash, accounts receivable, inventory, equipment, real estate). Liabilities are what your business owes (accounts payable, loans, credit card balances, deferred revenue). Equity is the difference — the net worth of your business.
What lenders care about:
- Current ratio. Current assets (things you can convert to cash within 12 months) divided by current liabilities (obligations due within 12 months). This tells the lender whether you can pay your near-term bills. A ratio above 1.5 is generally healthy. Below 1.0 means your short-term obligations exceed your liquid assets — a serious flag.
- Debt-to-equity ratio. Total liabilities divided by total equity. A high ratio means you’re heavily leveraged. Lenders use this to assess how much additional debt your business can responsibly carry.
- Collateral. If you’re applying for a secured loan, lenders will look at your tangible assets — equipment, real estate, inventory — to understand what can back the loan if you default.
The numbers that trip women up:
- Mixing personal and business assets. If you’ve been using personal funds to cover business expenses (or vice versa), your balance sheet may be muddier than it should be. Lenders expect clean separation. If it’s messy, a conversation with your accountant before your loan application is not optional.
- Informal family loans. Money borrowed from family members — even with a handshake agreement — should appear as a liability if it’s been used in the business. If it’s not on your balance sheet, a savvy lender may find it anyway through your tax returns. Better to surface it yourself with a clear explanation.
- Inventory valuation. If your business carries inventory, the method you use to value it (FIFO, LIFO, weighted average) can materially affect your balance sheet. Know which method your accountant uses and why.
Your homework:
Pull your most recent balance sheet and calculate:
- Current ratio = Current Assets ÷ Current Liabilities
- Debt-to-equity ratio = Total Liabilities ÷ Total Equity
If your current ratio is below 1.5 or your debt-to-equity is high relative to your industry, you need to be prepared to explain the context — not hide from it. Lenders respect owners who understand their own vulnerabilities.
The Cash Flow Statement — The One Lenders Trust Most
What it is: The cash flow statement tracks how cash actually moves into and out of your business during a period. Unlike the P&L, which can be affected by accounting methods (accrual vs. cash basis), the cash flow statement captures reality: money in, money out, net change in cash.
It’s divided into three sections:
- Operating activities — Cash generated by your core business operations
- Investing activities — Cash used for or received from purchasing/selling assets
- Financing activities — Cash from loans, equity, or repayments to investors and lenders
Why lenders trust it over the P&L:
Accrual accounting allows businesses to record revenue when it’s earned rather than when it’s collected. That means your P&L can show a profitable year while your actual cash position is stressed. Cash flow doesn’t lie. A business can be profitable on paper and cash-starved in practice — and lenders know this. Your operating cash flow is the closest thing to your business’s heartbeat.
What lenders look at:
- Operating cash flow. Is it positive? Consistently? A positive operating cash flow means your core business generates cash. Negative operating cash flow — even with positive net income — requires a clear explanation.
- Free cash flow. Operating cash flow minus capital expenditures. This is the cash available to service new debt. If your free cash flow is thin, taking on additional debt becomes risky — and lenders will flag it.
- Seasonal patterns. Many businesses have predictable cash flow swings. If your business is seasonal, lenders want to see that you’ve planned for the troughs — that you’re not going to miss a loan payment in January just because your business is slow in January.
The DSCR calculation — know this number before anyone asks:
The Debt Service Coverage Ratio (DSCR) is the single most important ratio for any business applying for a loan. It measures whether your business generates enough cash to cover its debt obligations.
DSCR = Net Operating Income ÷ Total Annual Debt Service
Net operating income is your earnings before interest and taxes (EBIT). Total debt service is the sum of all principal and interest payments you owe in a year — including the new loan you’re applying for.
Most lenders require a DSCR of at least 1.25x. That means for every $1.00 in debt payments, your business generates $1.25 in operating income. A 1.0x ratio means you’re breaking even on your debt — no cushion. Below 1.0 means you can’t cover your existing debt from operations.
Calculate yours. If it’s below 1.25, you either need to make the case that income is growing, or you need to reconsider the loan size. Knowing this number before a lender does is the difference between walking in prepared and walking out denied.
The Five Numbers Every Lender Calculates (And You Should Too)
Every lender, regardless of institution, is running the same mental math on your application. Here are the five ratios they’re calculating — and what the numbers mean in practice.
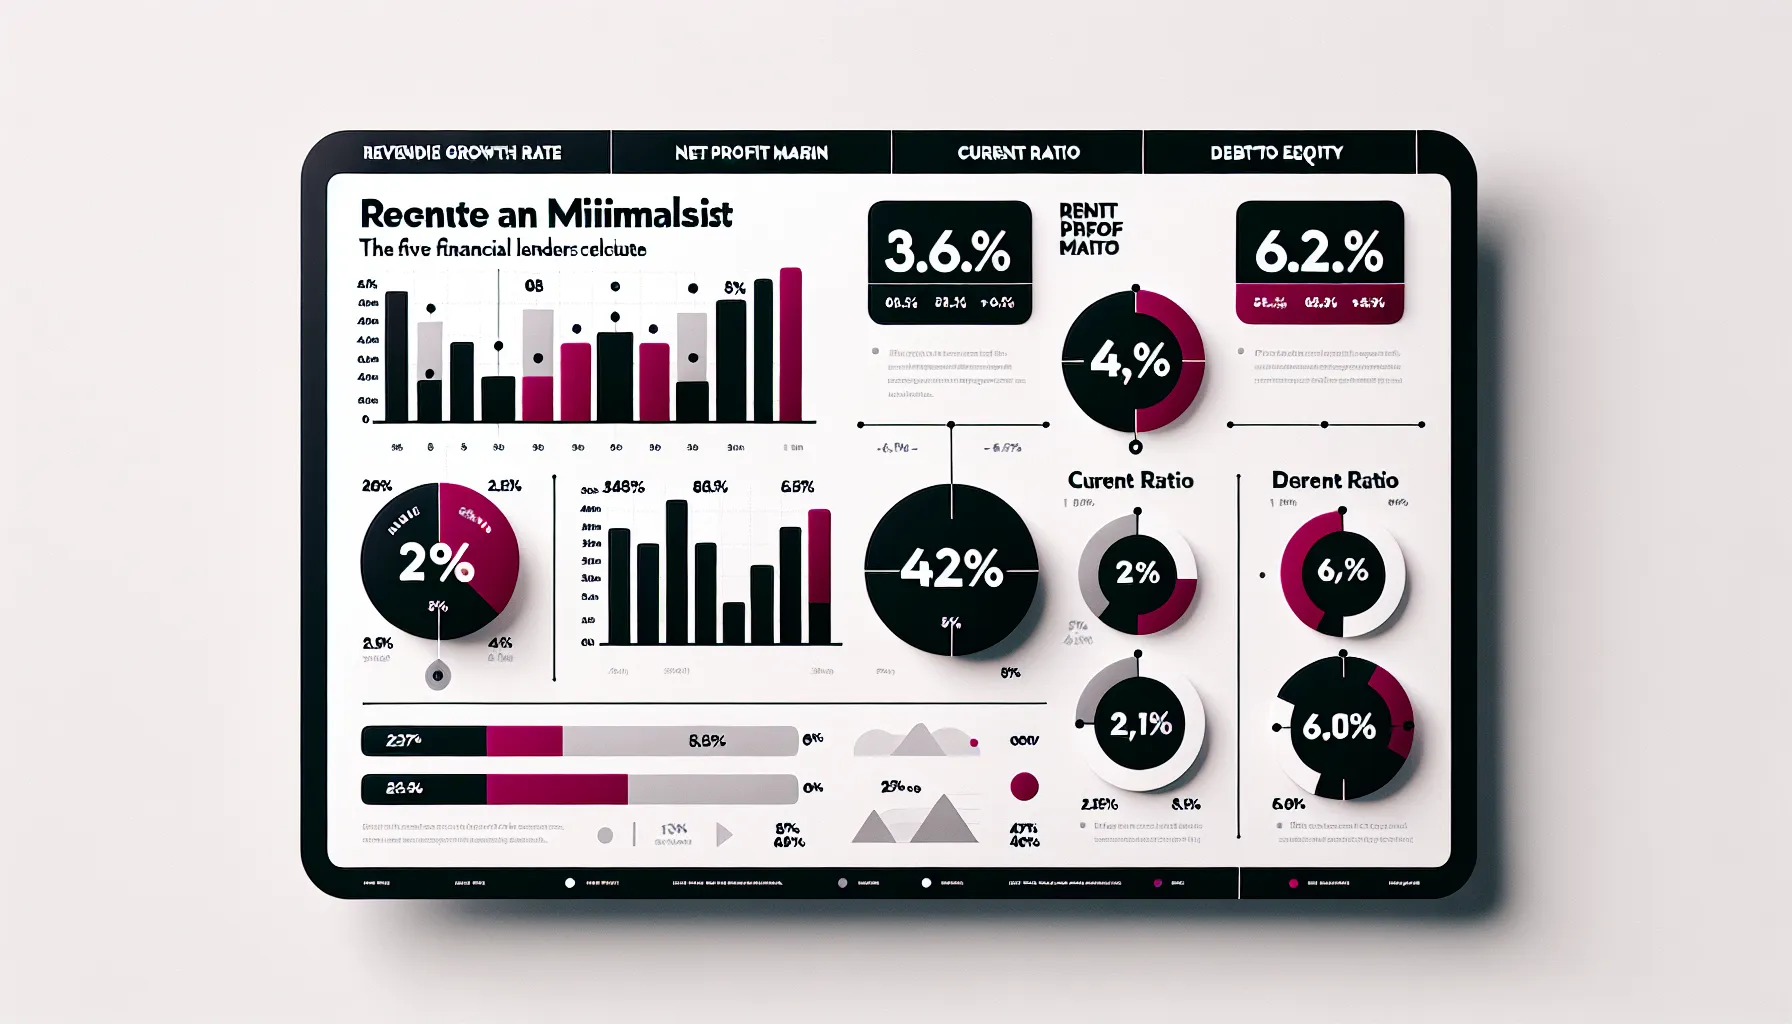
1. Revenue Growth Rate
Formula: (Current Year Revenue − Prior Year Revenue) ÷ Prior Year Revenue
What it signals: Growth trajectory. Lenders want to lend to businesses that are expanding, not contracting. Even modest, consistent growth is more compelling than a single spike year.
Example: If your revenue was $400,000 last year and $460,000 this year, your growth rate is 15%. That’s a story worth telling.
Watch for: A single strong year following a down year may look like growth but actually represents recovery. Know the difference and explain it.
2. Net Profit Margin
Formula: Net Income ÷ Total Revenue
What it signals: How much of each revenue dollar you actually keep. Industry benchmarks vary widely — check Investopedia’s small business financial ratios reference for context on your sector.
Example: $50,000 net income on $400,000 revenue = 12.5% margin. Service businesses often run 15–25%. Retailers often run 2–5%.
Watch for: Margins that are compressing over time (declining) vs. margins that are improving. Lenders look for trend, not just snapshot.
3. Current Ratio
Formula: Current Assets ÷ Current Liabilities
What it signals: Short-term liquidity — your ability to cover obligations due within 12 months.
What “good” looks like: 1.5 or above. Concern territory: Below 1.2. Red flag: Below 1.0.
Example: $120,000 in current assets, $80,000 in current liabilities = 1.5 ratio. You have $1.50 in liquid assets for every $1.00 in near-term obligations.
4. Debt-to-Equity Ratio
Formula: Total Liabilities ÷ Total Owner’s Equity
What it signals: How leveraged your business is. A high ratio means creditors own more of your business than you do, in practical terms.
What “good” looks like: Below 2.0 for most small businesses, though industry norms vary. Capital-intensive businesses (manufacturing, construction) typically run higher ratios than service businesses.
Example: $150,000 in liabilities and $200,000 in equity = 0.75 debt-to-equity. You’re conservatively leveraged.
Watch for: If you’re adding new debt through this loan, your debt-to-equity ratio will shift. Calculate where it lands post-loan — lenders will.
5. Debt Service Coverage Ratio (DSCR)
Formula: Net Operating Income ÷ Total Annual Debt Service (including the proposed new loan)
What it signals: Whether your business can afford the debt you’re asking to take on.
Minimum threshold: 1.25x. The SBA uses DSCR as a primary qualifying factor for many of its loan programs.
Example: $75,000 NOI and $55,000 in total annual debt service (existing + proposed) = 1.36 DSCR. You clear the 1.25x minimum.
If you’re below 1.25: Either reduce the loan amount, extend the repayment term (which reduces annual debt service), or make a compelling case that revenue growth will close the gap quickly. That last option requires credible projections.
Presenting Your Numbers — The Lender Meeting Prep Checklist
Knowing your numbers and presenting them are two different skills. Here’s how to walk into a lender meeting ready.
Documents to bring (printed clean copies):
- Three years of P&L statements
- Three years of balance sheets
- Three years of cash flow statements
- Three years of business tax returns (and personal, if required)
- Current accounts receivable aging report (if applicable)
- Current accounts payable schedule (if applicable)
One-page financial summary:
Prepare a single-page summary that shows, at a glance:
- Revenue for each of the last 3 years and YoY growth rate
- Net profit margin for each year
- Your five key ratios (the ones from the previous section)
- A two-sentence narrative: where you’ve been, where you’re going
This document does two things. It signals that you understand your own business. And it makes the lender’s job easier — which they will remember.
Rehearse your narrative:
The lender will ask you to tell them about your business. Don’t wing this. Prepare and practice a 3-minute version:
- What your business does and who it serves
- Your revenue trajectory over the last three years and what drove it
- Why you’re applying for this loan and specifically how it will grow the business
- What the repayment looks like and why you’re confident in it
Then prepare the 60-second version. If a decision-maker only gives you one minute before they have to take another meeting, what’s the essential story? Revenue is growing at X%. Margins are Y%. DSCR is Z. This loan funds [specific initiative] that will [specific outcome]. Nail the 60-second version and you’ll own any room.
Anticipate the hard questions:
Every application has a soft spot. A year where revenue dipped. A line of credit that went higher than comfortable. A client who represented 40% of revenue and then left. Identify your soft spots before the lender does. Come with an honest explanation and evidence that the risk has been mitigated.
Questions to prepare for:
- “I see revenue was down in [year]. What happened?”
- “Your largest customer represents X% of revenue. What happens if you lose them?”
- “Your net margin has been declining. Why?”
- “You took a large distribution in [year]. Was that related to business needs?”
Bring projections — but make them defensible:
A 12-month revenue forecast with clearly stated assumptions is expected in most loan applications. What kills credibility is hockey-stick projections with no underlying logic. If you’re forecasting 30% growth, be prepared to name the specific contracts, market conditions, or operational changes that support that number.
Use SCORE’s free business financial tools to build projections that hold up to scrutiny.
Build From Here
Financial fluency isn’t a destination — it’s a practice. If you’re building your credit profile alongside your loan prep, start with building your business credit before you’re deep in an application cycle. Credit history takes time; financial statements take 90 minutes.
If you’re exploring the full range of loan products available to women-owned businesses, the complete breakdown of SBA loans for women covers the specific programs, eligibility requirements, and application tactics that apply to your business.
And when you get to the table: don’t accept the first terms you’re offered. The guide on negotiating your terms walks through exactly how to push back on rate, repayment schedule, and covenant requirements — with language you can use word-for-word.
If a previous application was denied, read what to do if your loan gets denied before you apply again. The denial letter contains information most business owners don’t know how to use. That guide shows you how.
All of this lives in The Funding Playbook — the full tactical library for women navigating business lending.
The Bottom Line
Your financials are not your accountant’s problem to explain. They’re yours.
The lender sitting across from you doesn’t know your business. They know numbers. Your job is to translate 36 months of operational reality into a financial narrative that is honest, clear, and forward-looking. Not because the numbers need spin — but because every business has a story, and you are the only person who can tell yours.
Pull the documents. Calculate the ratios. Rehearse the narrative. Then walk in like someone who knows exactly what they built.
And if you’re self-employed with multiple clients, make sure you understand how the 1099 threshold change affects your documentation — the gap between what you earn and what’s independently verified just got wider.
Because you do.
Additional resources: